Logging AFib Episodes
Quick Start an Episode
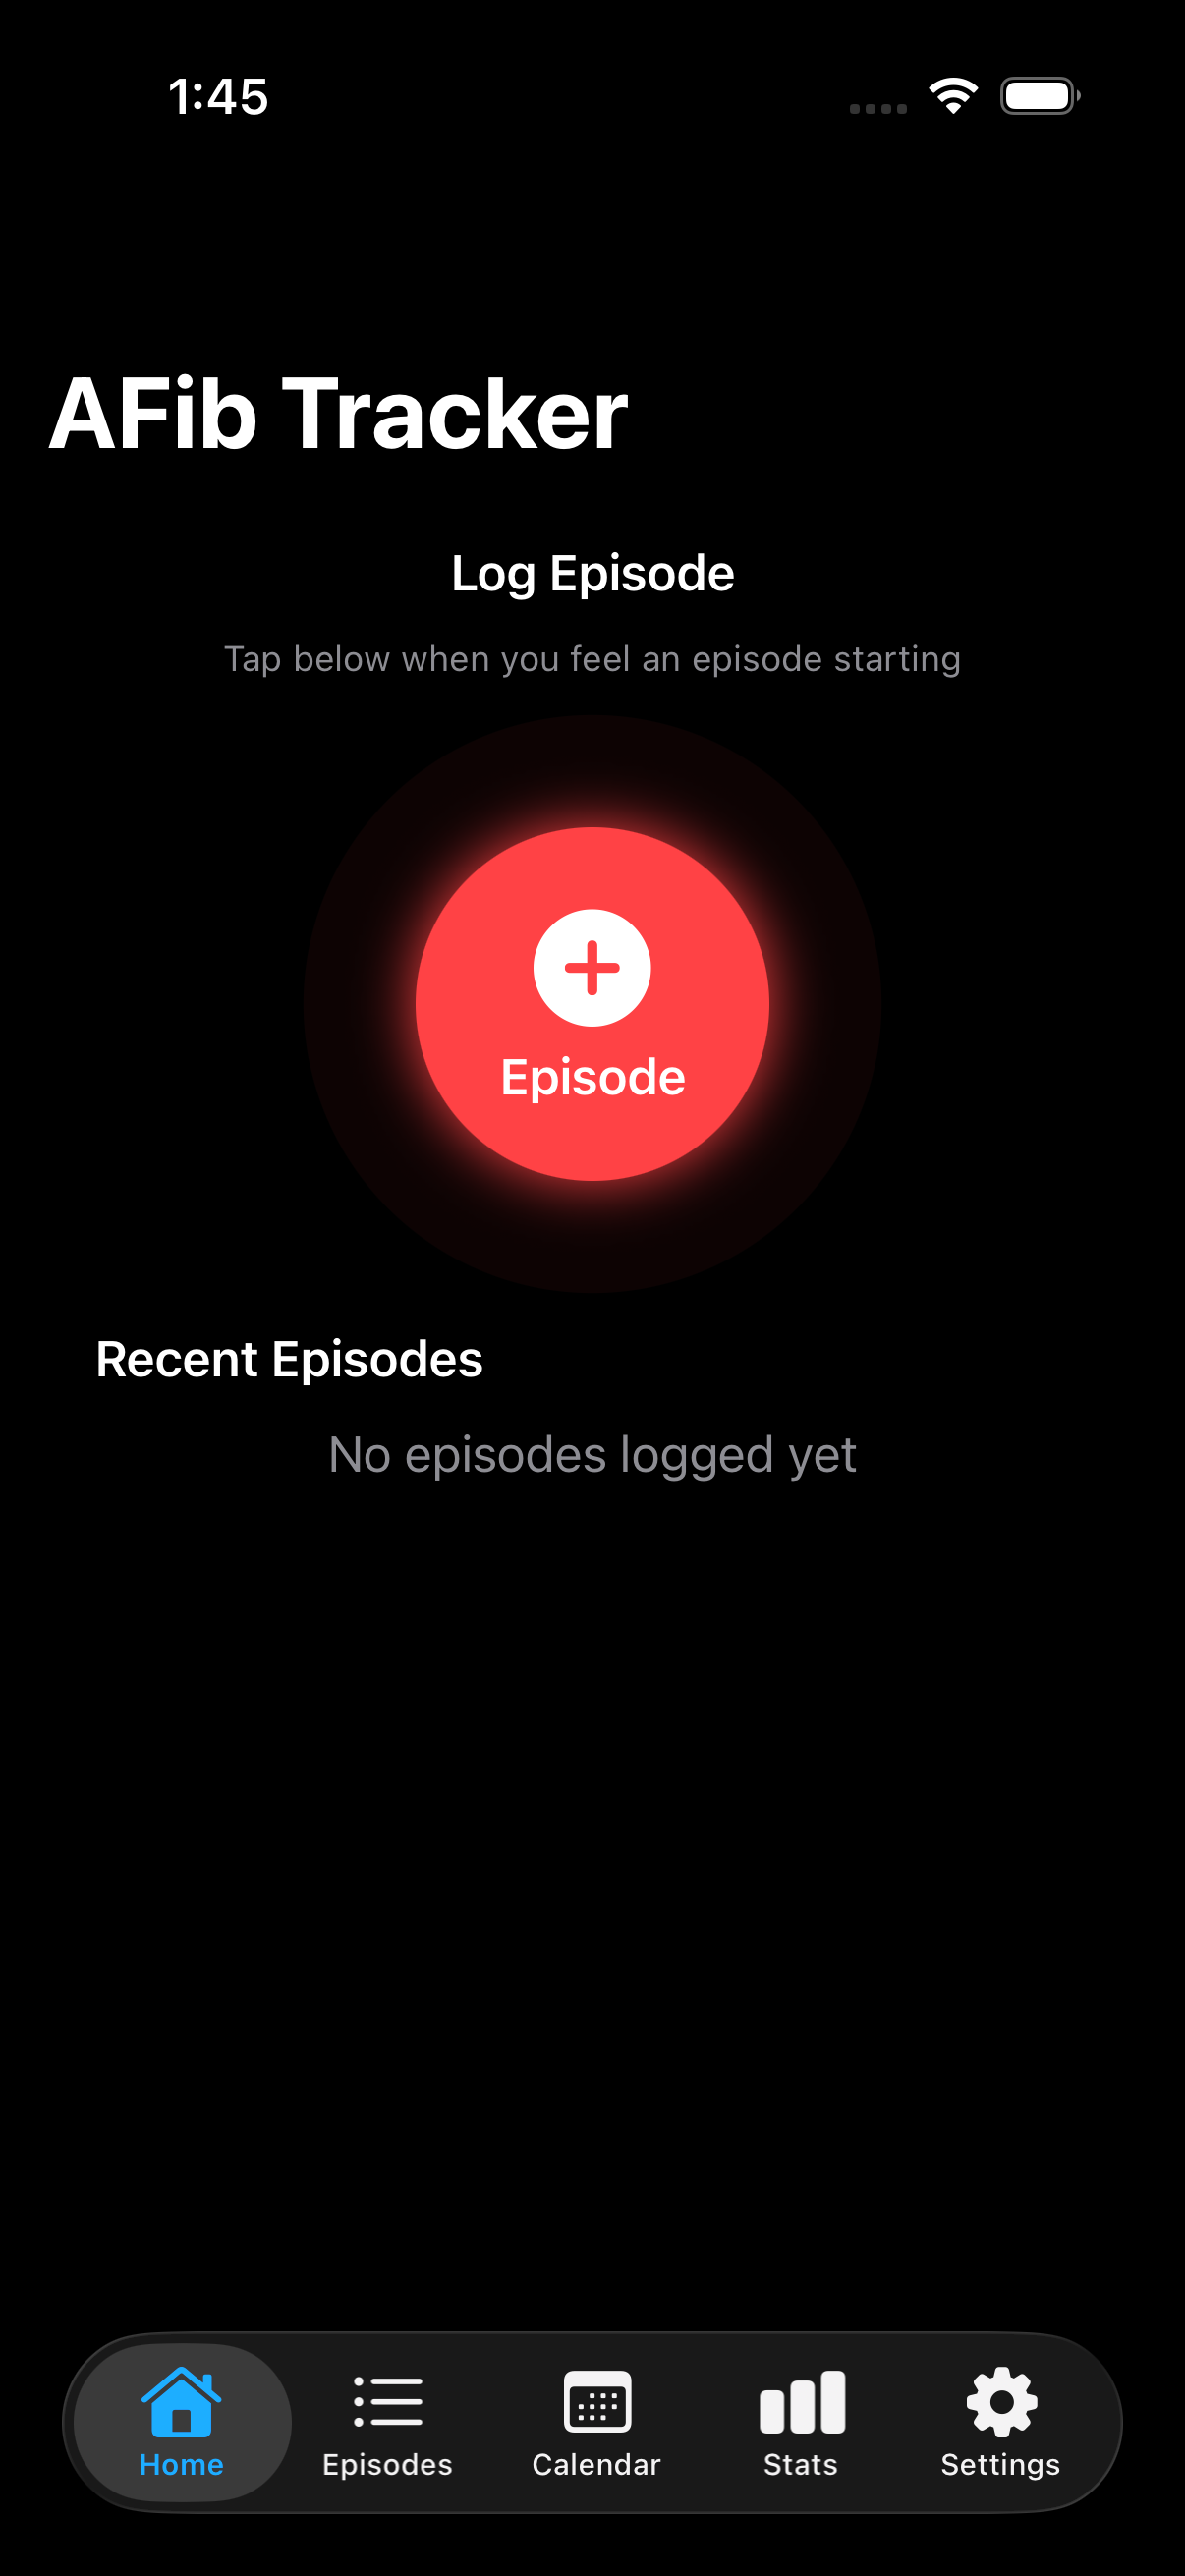
Tap the red "+" button on the home screen to instantly start tracking an episode. This is perfect for when you feel symptoms beginning and need to log quickly.

Add Episode Details
After starting an episode, at any time you can add details like:
- Start/End Time: Automatically tracked, or edit manually
- Intensity: Mild, Moderate, or Severe
- Triggers: Caffeine, Alcohol, Stress, Sleep Issues, and more
- Medications: Log any medications taken during the episode, with timing and dosage details
- Notes: Free-form text for symptoms or observations

End an Episode
For in-progress episodes, tap the "End Episode" button to record when symptoms stopped. The duration is automatically calculated and displayed.
If there was an action that you took that may have helped end the episode (e.g. Valsalva) add it to the episode. New can create custom resolutions in Settings

View Episode Details
Tap any episode in the Episodes list to see full details. The detail view shows all recorded information in a clean, easy-to-read format.
Tap edit if you would like to update any of the details.

Connect Apple Health (Optional)
If you have an Apple Watch, Tonnta can read your heart rate and ECG data to correlate with episodes. Go to Settings → HealthKit and grant permission to get started.
HealthKit data is read-only and stored locally on your device. You can revoke access at any time in iOS Settings → Privacy → Health.
Understanding Your Data
Statistics Dashboard
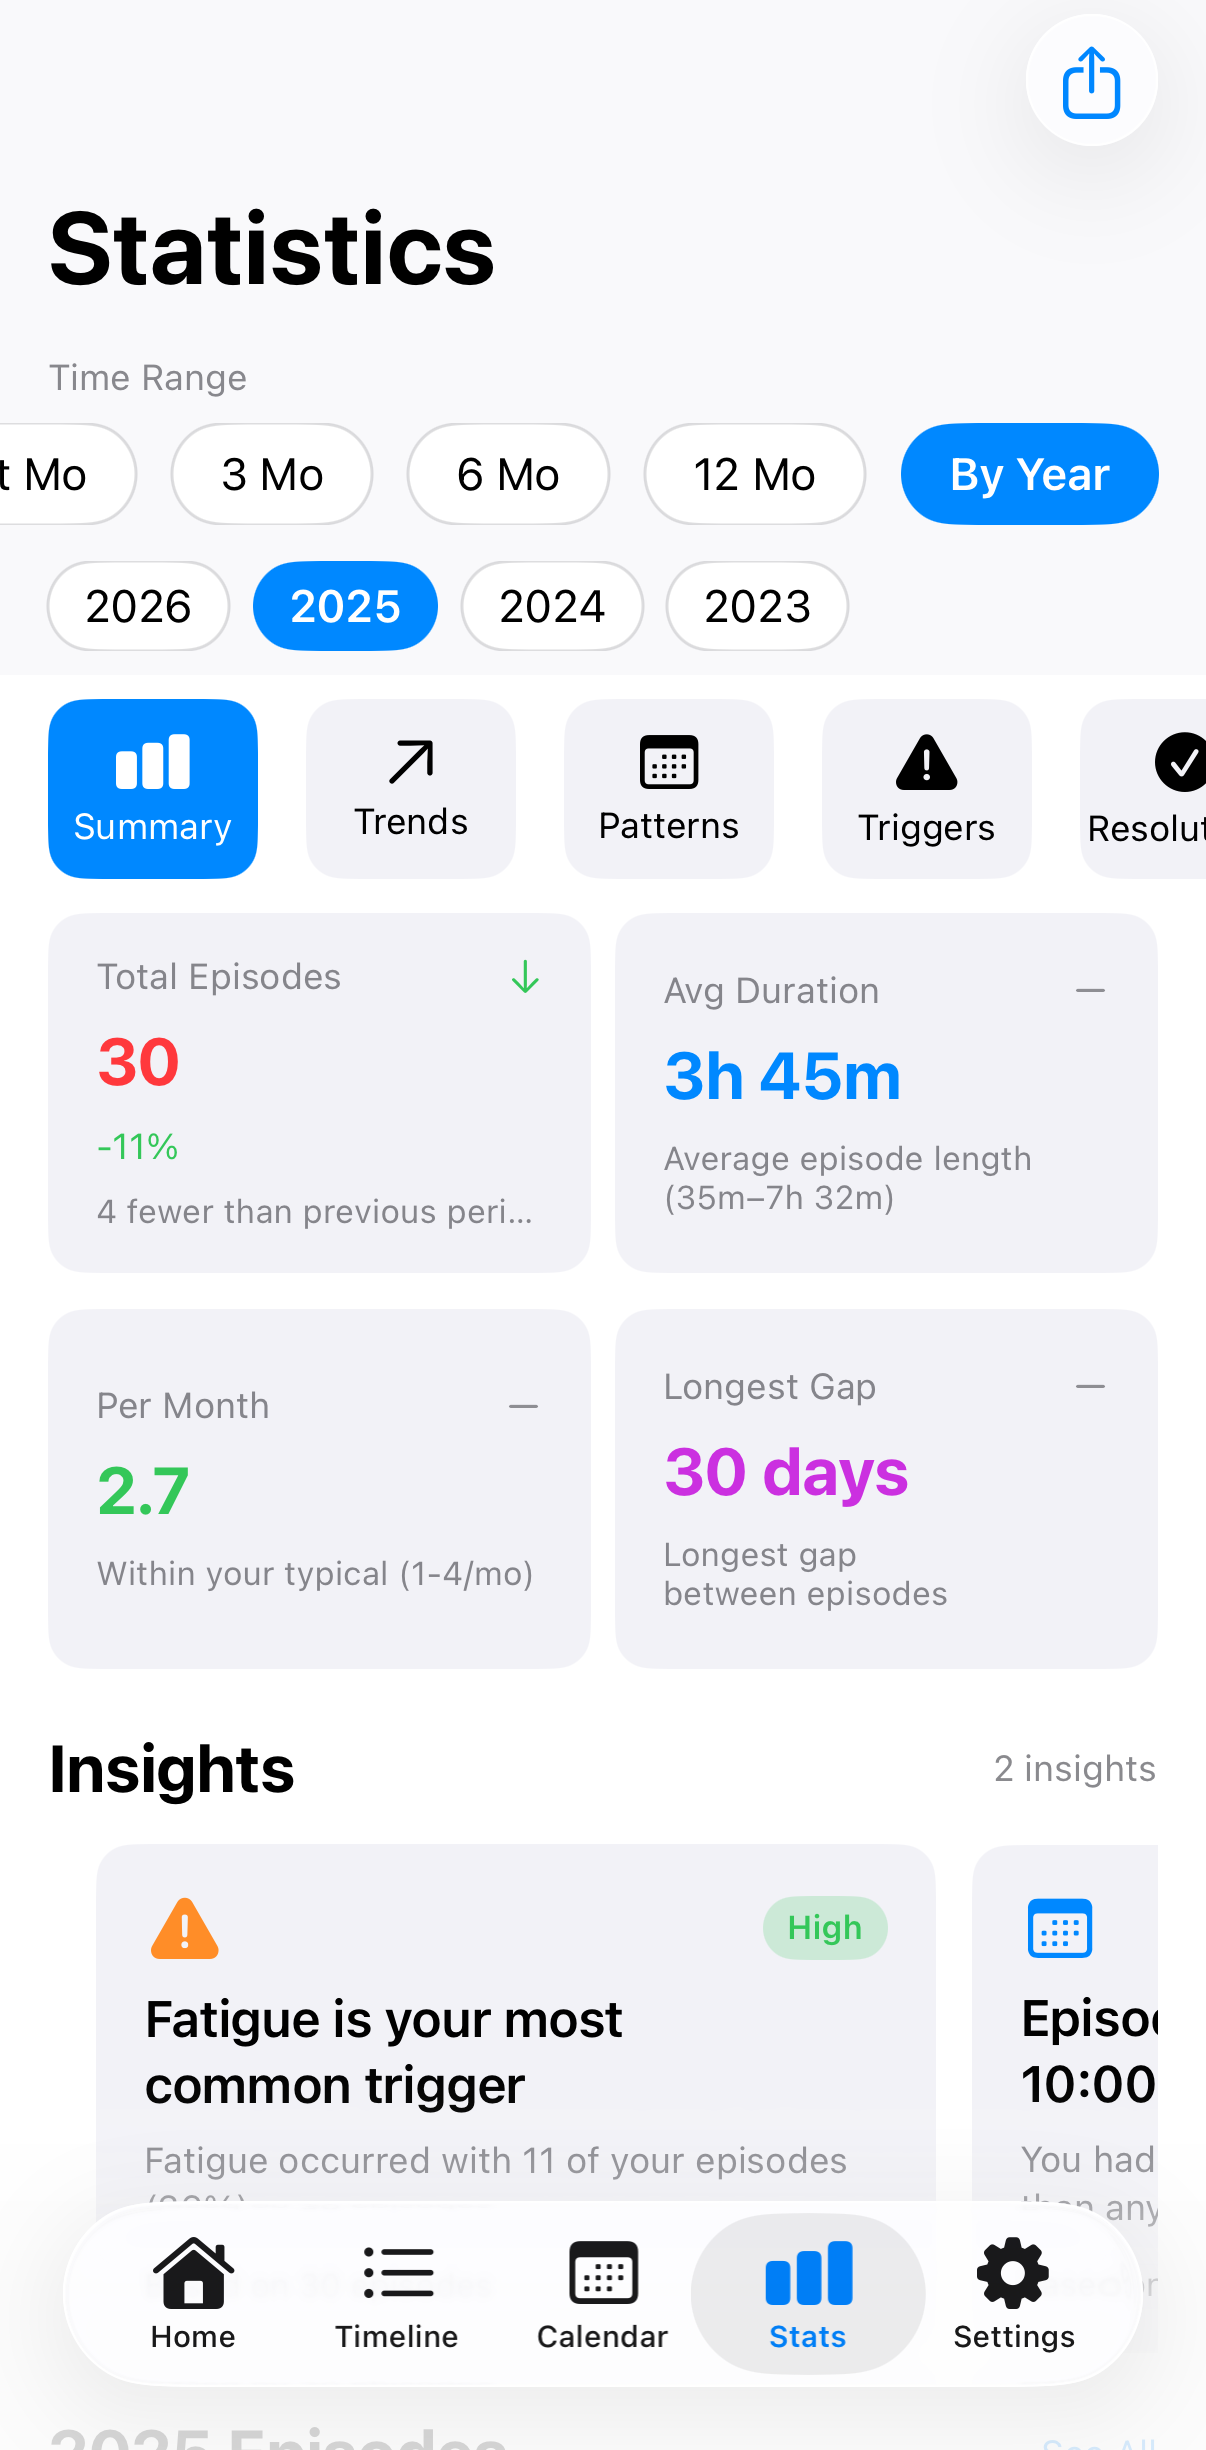
The Stats tab shows key metrics about your episodes, for example:
- Total Episodes: Overall count in selected time range
- Average Duration: Typical length of your episodes
- Episodes Per Month: Frequency over time
- Common Triggers: Which triggers co-occur most often
- Afib Burden %: The % of time in a given month that you are in an AFib episode
Filter by Time Range
Switch between "All Time", "This Month", or "By Year" to focus on specific periods. This helps identify seasonal patterns or evaluate the impact of treatment changes.
Calendar View
The Calendar tab shows a visual overview of your episodes. Days with episodes are marked with colored indicators based on intensity (green for mild, orange for moderate, red for severe).

Tip
Tap any day on the calendar to see episodes for that day. Long-press to quickly add an episode.
Export for Your Doctor
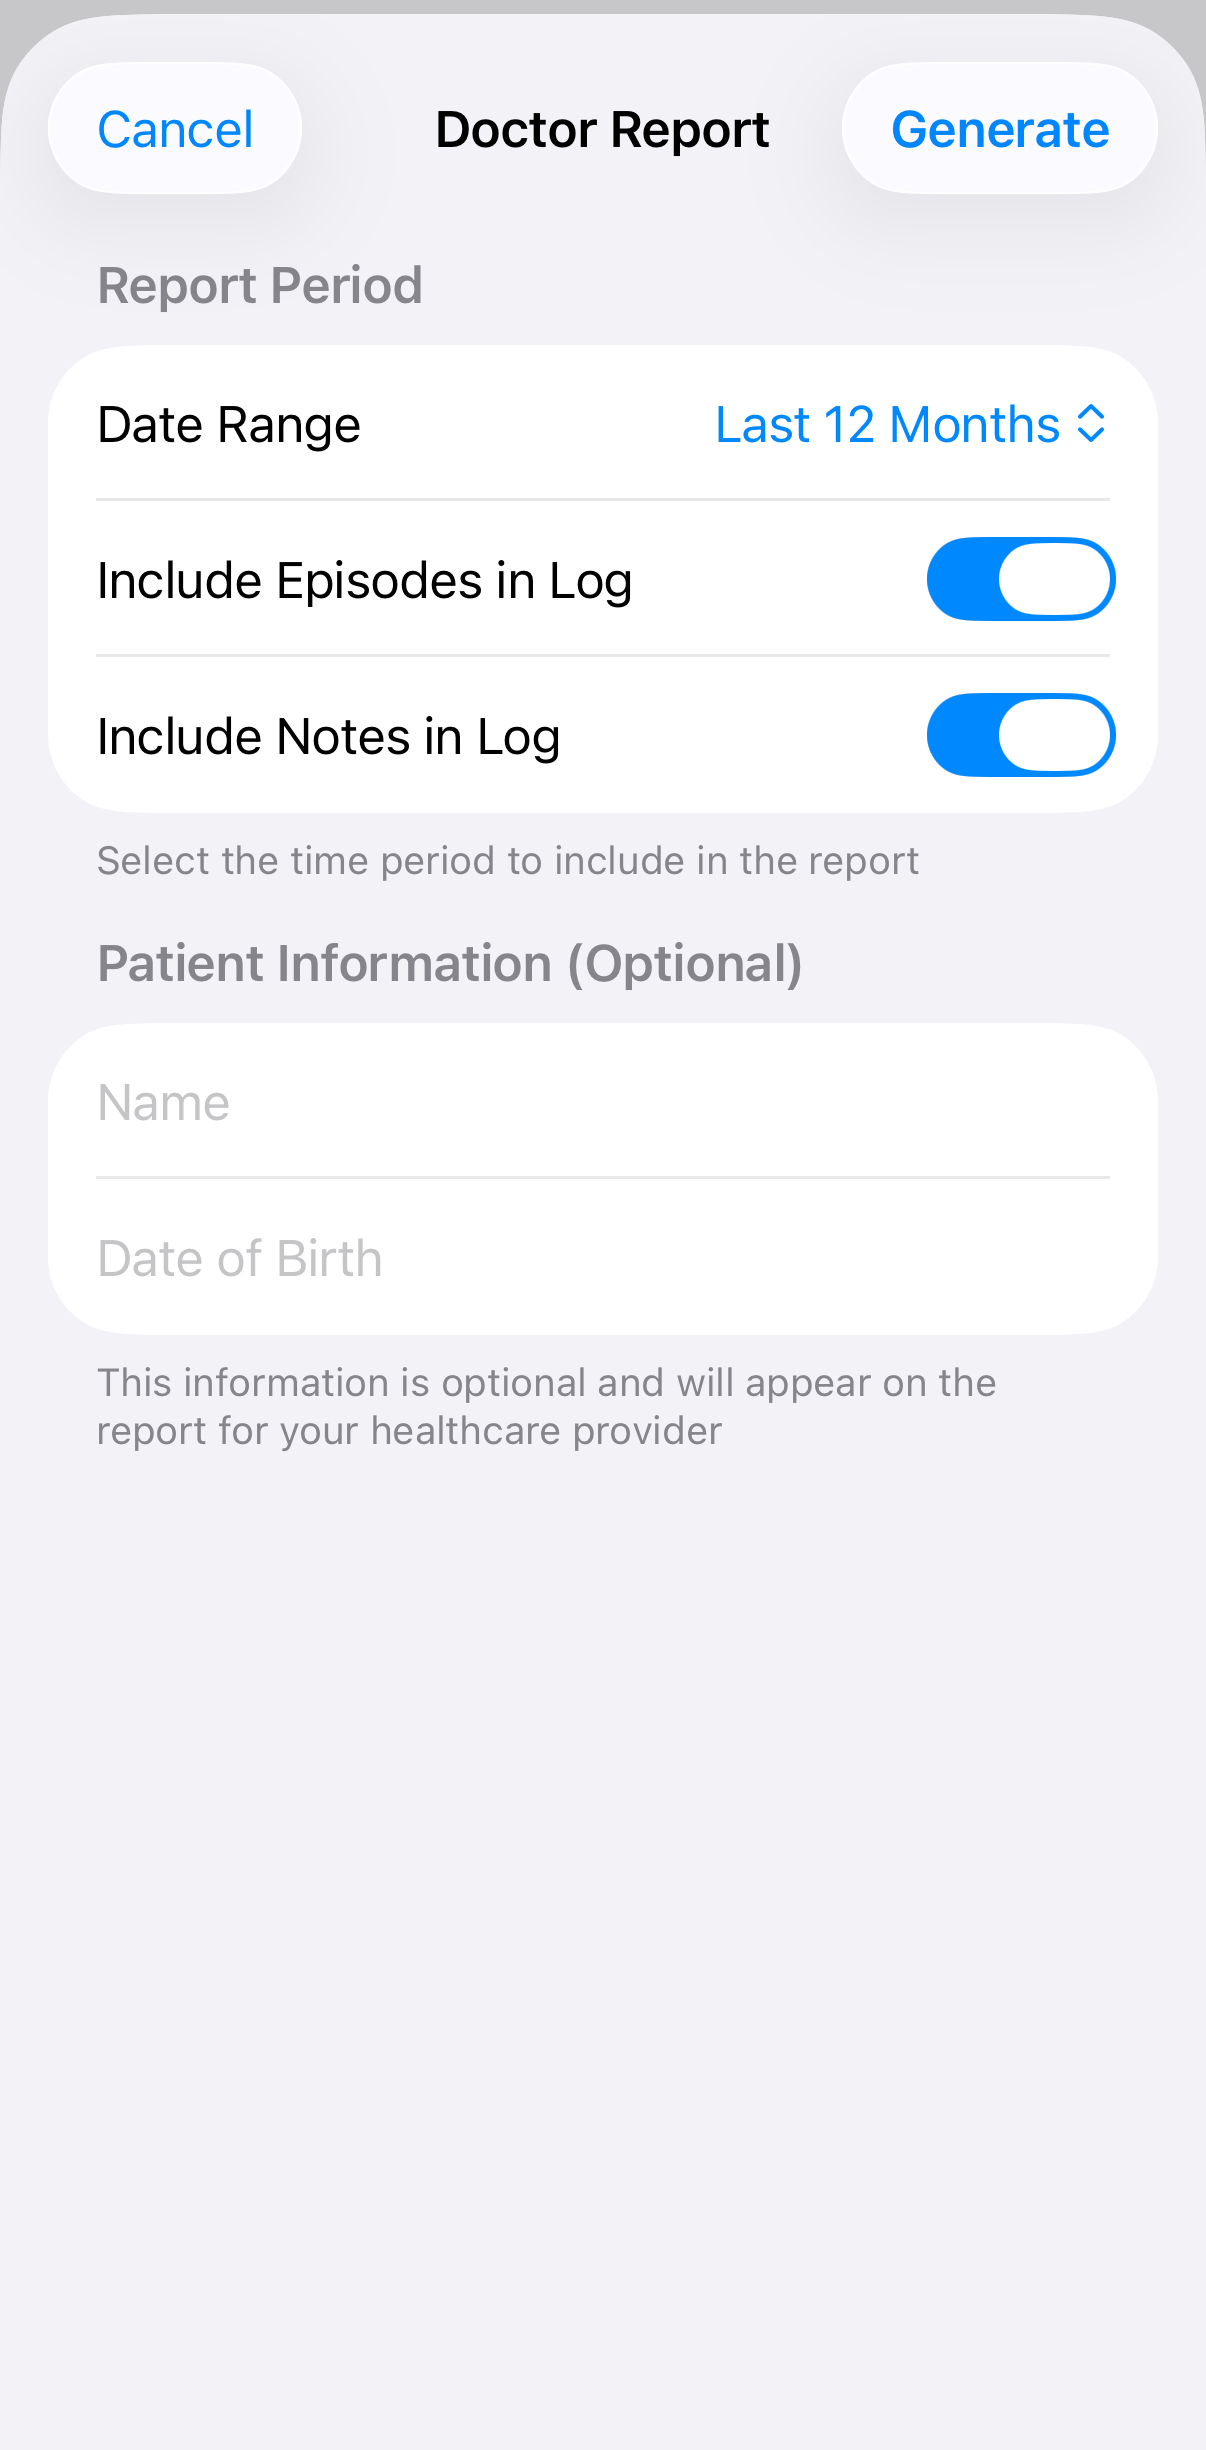
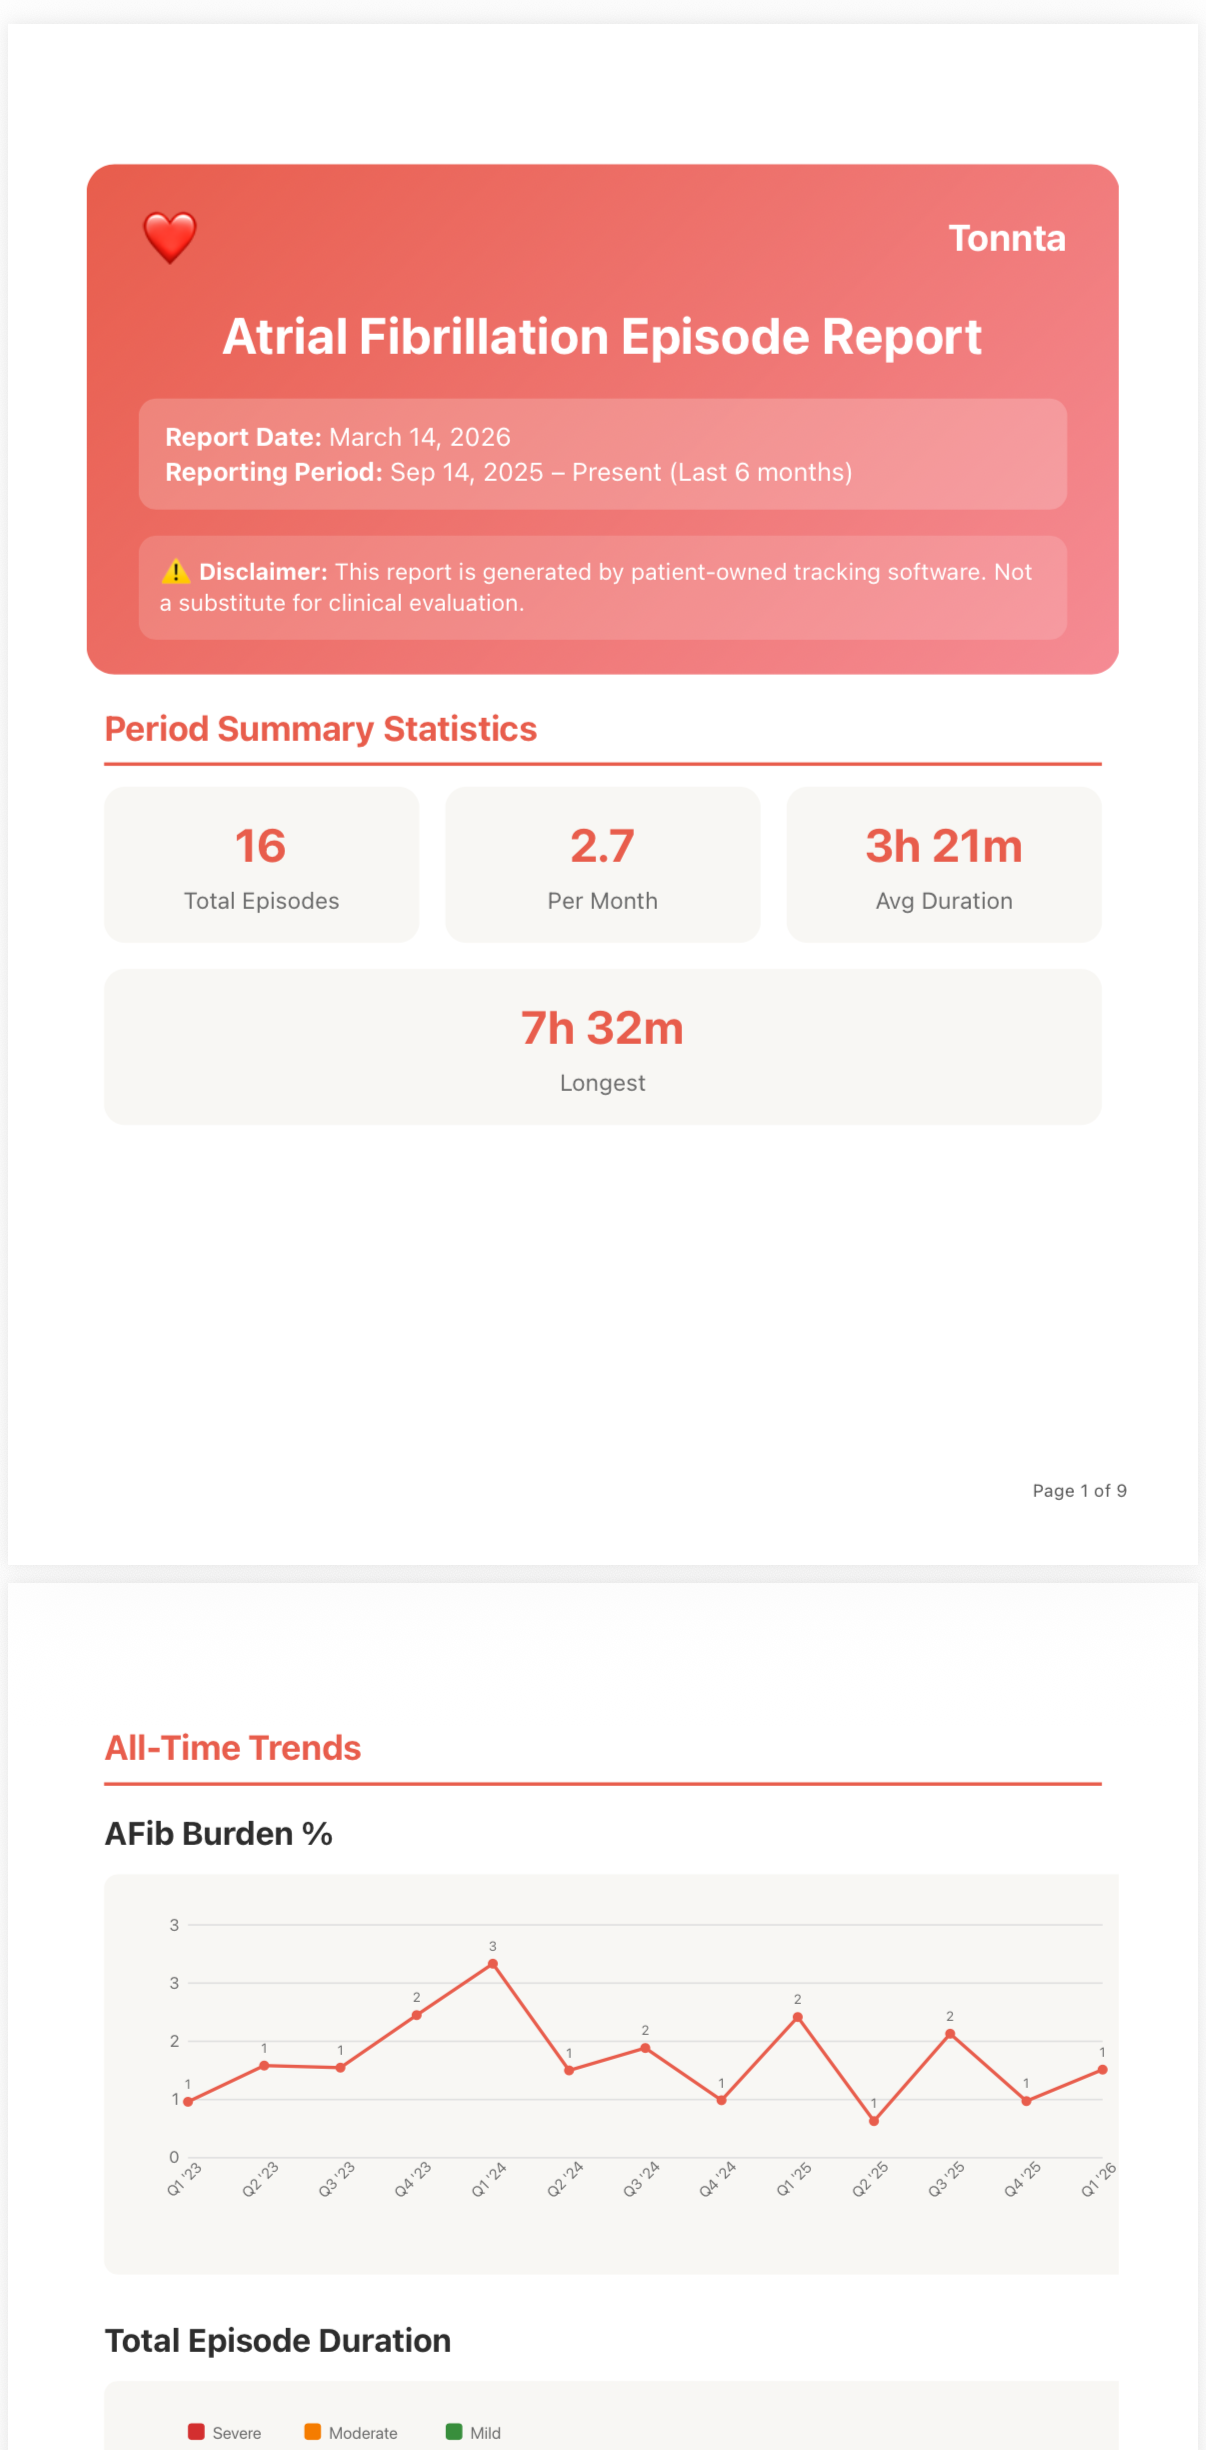
Generate a doctor report from the Stats tab using the share button to create a PDF report to share with your healthcare provider. Includes summary statistics and an optional detailed episode log.
Getting The Most From Tonnta
Logging Consistency
- Log Immediately: Use the quick start button when symptoms begin. You can always add details later.
- Establish Your Personal Baseline: Intensity is subjective. What's "Moderate" for you might be "Mild" for someone else. Focus on being consistent with your own labels to help identify personal trends.
- Note Potential Triggers: Even if you're not certain, logging potential triggers like poor sleep or high stress helps identify long-term correlations.
Customizing Your Experience
- Add Custom Triggers: Go to Settings to add triggers specific to your situation (e.g., "Weather change", "Skipped medication").
- Add Custom Resolutions: Go to Settings to add actions that help you end episodes (e.g., "Deep Breathing", "Cold Water Splash").
- Enable iCloud Sync: Enable sync in Settings for peace of mind. Your data is encrypted and private, and it ensures you never lose your history if you lose your phone.
- Manage Medications: Add your medications in Settings for quick access during episode logging. Common medications are included, add your own as needed.
CSV Format Reference
Learn more about the CSV format for importing and exporting your data:
View CSV Format GuideWorking with Your Doctor
- Before Appointments: Generate a doctor report to share relevant history.
- Focus on Patterns: Use the statistics to discuss trigger correlations and frequency changes.
- Track Medication Effects: Note changes in episode patterns after medication adjustments.
- Search for Specifics: During an appointment, use the search bar in the Timeline to quickly find episodes where you noted 'heavy chest' or 'skipped beat'.